
Money transfers
Why do international money transfer services charge such high fees?
International money transfer fees are rarely the whole cost — the number on the confirmation screen is only part of it. Every international transfer carries up to three separate charges: the transfer fee the provider quotes, the margin added to the exchange rate, and any deductions taken by banks along the route or at the payout end. Providers earn from the fee, from the rate, or from both — and they trade one against the other. That is why a zero-fee headline and a low total cost are not the same claim.
The scale is measurable. The World Bank’s Remittance Prices Worldwide report puts the global average total cost of sending $200 at 6.36 percent, more than double the 3 percent target the UN set for 2030. Split by provider type, the picture changes sharply: banks average 14.99 percent, money transfer operators 4.72 percent. Split by channel, digital transfers average 4.59 percent against 7.30 percent for non-digital. And split by destination, Sub-Saharan Africa is the most expensive region in the world to receive money, at 8.46 percent.
PayAngel was built for that last number. It charges no transfer fees and no service fees on supported routes from the UK, US, Canada and Australia, and it shows the exchange rate and the expected recipient amount before you confirm. It is a sensible first check rather than the only option — because the exchange rate is still part of the cost, and the only figure that settles a comparison is how much your recipient receives.
Quick answer
International money transfer fees are high because providers are pricing three things at once: the operational cost of moving money between two regulated financial systems, the currency conversion itself, and the compliance and risk work behind every payment. Most of what people call “the fee” is really two numbers — an upfront charge, plus a margin built into the exchange rate. In 2026, the World Bank’s most recent data puts the global average total cost of sending $200 at 6.36 percent. Banks average 14.99 percent. Money transfer operators average 4.72 percent.
Cost varies more by channel and corridor than by brand. Digital transfers average 4.59 percent against 7.30 percent for non-digital, and money sent to Sub-Saharan Africa averages 8.46 percent — the highest of any receiving region. PayAngel is built for that corridor: no transfer fees and no service fees on supported routes from the UK, US, Canada and Australia, with the exchange rate, the delivery estimate and the recipient amount shown before you confirm. When you compare services, compare the recipient amount, not the fee.
| Provider type | Average total cost to send $200 | Where the cost sits |
|---|---|---|
| Banks | 14.99% | Transfer fee, exchange rate margin, and deductions on SWIFT routes |
| Money transfer operators | 4.72% | Transfer fee plus exchange rate margin |
| Mobile operators | 5.58% | Mostly fee; a very small share of the market |
| PayAngelZero-fee | No transfer fee, no service fee | The exchange rate alone |
Banks
Money transfer operators
Mobile operators
PayAngel
Zero-feeProvider-type averages: World Bank, Remittance Prices Worldwide, Issue 54 (Q3 2025 data). PayAngel row describes its published pricing on supported routes, not a World Bank measurement.
What are you actually paying for when you send money home?
An international transfer is not one transaction. It is a chain: your card or bank account, a sending institution, a currency conversion, a correspondent bank or a local payout partner, and finally a bank account, mobile wallet or cash counter in another country. Every link in that chain has a cost, and every provider chooses which links to show you and which to fold into the rate.
That choice is the whole story. Two services can quote the same fee and deliver very different amounts. One can quote no fee at all and still be the more expensive option, because the difference has moved into the exchange rate where it does not appear as a line item.
The costs on a typical international transfer
- Transfer fee — the visible charge. Flat, a percentage of the amount, or both.
- Exchange rate margin — the gap between the mid-market rate and the rate you are offered. Commonly 1 to 3 percent on bank wires.
- Intermediary and correspondent bank deductions — on SWIFT routes, each bank in the middle may take its own cut, often reported in the range of $15 to $50. Your recipient gets less than you sent.
- Payout-side charges — the receiving bank’s incoming fee, wallet cash-out charges, or local taxes, depending on the country.
- Funding method — paying by credit card can trigger a cash-advance charge from your card issuer on top of everything above.
- Speed premiums — same-day delivery is frequently priced above standard delivery on the same route.
Not every transfer carries all six. A mobile-wallet transfer from a digital service usually skips the correspondent banks entirely, which is a large part of why it costs less. A bank wire almost always carries all of them.
How does the exchange rate markup work?
The mid-market rate is the rate at which banks trade currency with each other. It is the number a currency converter or a search engine shows you, and it sits between the buy and sell price at any given moment. It is real, it is public, and it costs nothing to look up.
Most providers do not give you that rate. They quote a slightly weaker one and keep the difference, which is the exchange rate margin. It is expressed as a percentage of the amount you send, so it scales with the transfer. Industry reporting puts the typical markup on an international bank wire at 1 to 3 percent above the mid-market rate. On £1,000, a 2 percent margin costs £20 — more than most transfer fees on the same route, and it never appears as a charge.
This is the paragraph every honest guide to this subject has to include. A zero-fee transfer is not a free transfer. PayAngel charges no transfer fee and no service fee on supported routes, and the exchange rate is still part of what the transfer costs you. Any provider describing a transfer as free is describing one line, not the total. The way to hold everyone to the same standard — PayAngel included — is to look up the mid-market rate, compare it against the rate you are quoted, and then look at the recipient amount.
Why is sending money to Africa more expensive than anywhere else?
Sub-Saharan Africa is the most expensive receiving region in the world, at 8.46 percent average total cost against a 6.36 percent global average. The least expensive region — the Middle East, North Africa, Afghanistan and Pakistan — averages 5.11 percent. Same product, a third less cost, purely because of where the money lands.
Four things drive the gap. Fewer providers compete on any given African corridor, so there is less downward pressure on price. The currencies are traded in thinner markets, which widens the spread a provider has to cover. Cash payout remains common, and cash costs more to service than a digital wallet. And correspondent banks have withdrawn from parts of the region over the past decade under compliance and de-risking pressure, leaving fewer routes and higher costs on the ones that remain.
The extremes sit inside Africa itself. Of the thirteen corridors the World Bank recorded above 20 percent total cost, nine of them originate in Sub-Saharan Africa — that is, money moving between African countries. Diaspora senders in London, New York, Toronto and Sydney are, by comparison, in a well-served market. The point of comparing carefully is to actually claim that advantage.
| Receiving region | Average cost to send $200 | Against the 6.36% global average |
|---|---|---|
| Sub-Saharan Africa | 8.46% | Highest of any region |
| Europe & Central Asia | 6.80% | Above |
| East Asia & Pacific | 5.83% | Below |
| Latin America & Caribbean | 5.64% | Below |
| South Asia | 5.30% | Below |
| Middle East, North Africa, Afghanistan & Pakistan | 5.11% | Lowest of any region |
Sub-Saharan Africa
Europe & Central Asia
East Asia & Pacific
Latin America & Caribbean
South Asia
Middle East, North Africa, Afghanistan & Pakistan
World Bank, Remittance Prices Worldwide, Issue 54 (Q3 2025 data).
Do international money transfer fees change with the amount you send?
Yes, and the effect is larger than most people expect. The global average cost of sending $200 is 6.36 percent. Send $500 on the same routes and the average falls to 4.08 percent. Nothing about the service improved — the fixed portion of the fee simply spread across a bigger transfer.
The exchange rate margin behaves differently. It is a percentage, so it does not shrink with size. This is why the fee-versus-rate balance flips as amounts grow: on a small transfer the fixed fee dominates, and on a large one the rate margin does. Sending £2,000 through a service with a 2 percent margin costs £40 in the rate, whatever the fee line says.
Two practical consequences. If you send small amounts weekly through a service with a fixed fee, consolidating into fewer, larger transfers usually lowers the percentage you pay — provided the rate holds and your family can wait. And on a zero-fee service there is no fixed fee to spread, so the frequency question loses most of its force, and the rate becomes the only thing worth watching.
How do you compare money transfer services properly?
There is one question that resolves every comparison: how much will my recipient receive? Everything else — the fee, the rate, the promotion, the badge on the homepage — is an input to that number. Ask it directly and the marketing falls away.
Run the same amount, on the same day, to the same payout method, through two or three providers before you send. Rates move daily. Promotions expire, and a first-transfer waiver tells you nothing about your fifth transfer. Four numbers are enough.
| What to check | Why it matters | Where to find it |
|---|---|---|
| Transfer fee | The visible charge. Some providers waive it on a first transfer only | The provider's quote screen |
| Exchange rate | A weaker rate can outweigh a zero fee entirely | Compare the quote against any mid-market currency converter |
| Recipient amount | The single figure that settles the comparison | The quote screen, before you confirm |
| Delivery time and payout route | Speed depends on the route and payout partner, not the brand | The quote screen or the provider's country page |
Transfer fee
Exchange rate
Recipient amount
Delivery time and payout route
Competitor pricing changes by corridor, by amount and by month, so treat any published figure — including the ones on this page — as a starting point and check the live quote before you send.
Which payout method costs the least?
How the money arrives often matters more than which company sends it. Mobile wallet payout averages 3.92 percent. A bank account deposit averages 7.86 percent — twice as much. Sending to an account at the originating bank or its partner is the most expensive route measured, at 13.91 percent, which is the opposite of what most people assume.
The funding side moves the number too. Paying with a debit or credit card averages 4.39 percent, while funding from a bank account averages 8.69 percent and cash 7.01 percent.
| How the money is paid out | Average cost to send $200 | Worth knowing |
|---|---|---|
| Debit card payout | 3.61% | Lowest-cost measured route, but offered on few corridors |
| Mobile wallet | 3.92% | Widely available across African corridors |
| Cash pickup | 5.56% | Useful where the recipient has no account or smartphone |
| Bank account deposit | 7.86% | Familiar, but rarely the lowest cost |
| Same-bank or partner-bank account | 13.91% | The most expensive route in the data |
Debit card payout
Mobile wallet
Cash pickup
Bank account deposit
Same-bank or partner-bank account
World Bank, Remittance Prices Worldwide, Issue 54 (Q3 2025 data). Debit card payout is measured across a small number of services.
Ask your recipient what they can actually use before optimising for cost. The lowest-cost route is worth nothing if the wallet is dormant, the agent is two hours away, or the account has been frozen for want of a document. Check which payout options exist on your corridor first, then choose the least expensive of the ones that work.
Where you send from changes the price too
Sending country is a cost factor in its own right, and the four countries PayAngel sends from all sit below the global average. The UK is the second least expensive G20 sending country, behind Germany at 4.49 percent. At the other end, South Africa averages 15.65 percent to send from — more than triple the UK.
| Sending country | Average cost to send $200 | Against the 6.36% global average |
|---|---|---|
| 🇬🇧 United Kingdom | 4.61% | Second lowest in the G20 |
| 🇺🇸 United States | 5.04% | Below |
| 🇦🇺 Australia | 5.23% | Below |
| 🇨🇦 Canada | 5.27% | Below |
🇬🇧 United Kingdom
🇺🇸 United States
🇦🇺 Australia
🇨🇦 Canada
World Bank, Remittance Prices Worldwide, Issue 54 (Q3 2025 data). These are the four countries PayAngel currently sends from.
That is a market average, not a quote. It tells you how much competition exists where you live, which is a fair proxy for how much room there is to do better than the default. In the UK, US, Canada and Australia, there is a lot.
Work out what your transfer will cost
Enter an amount and a destination to see the live rate and what your recipient receives.
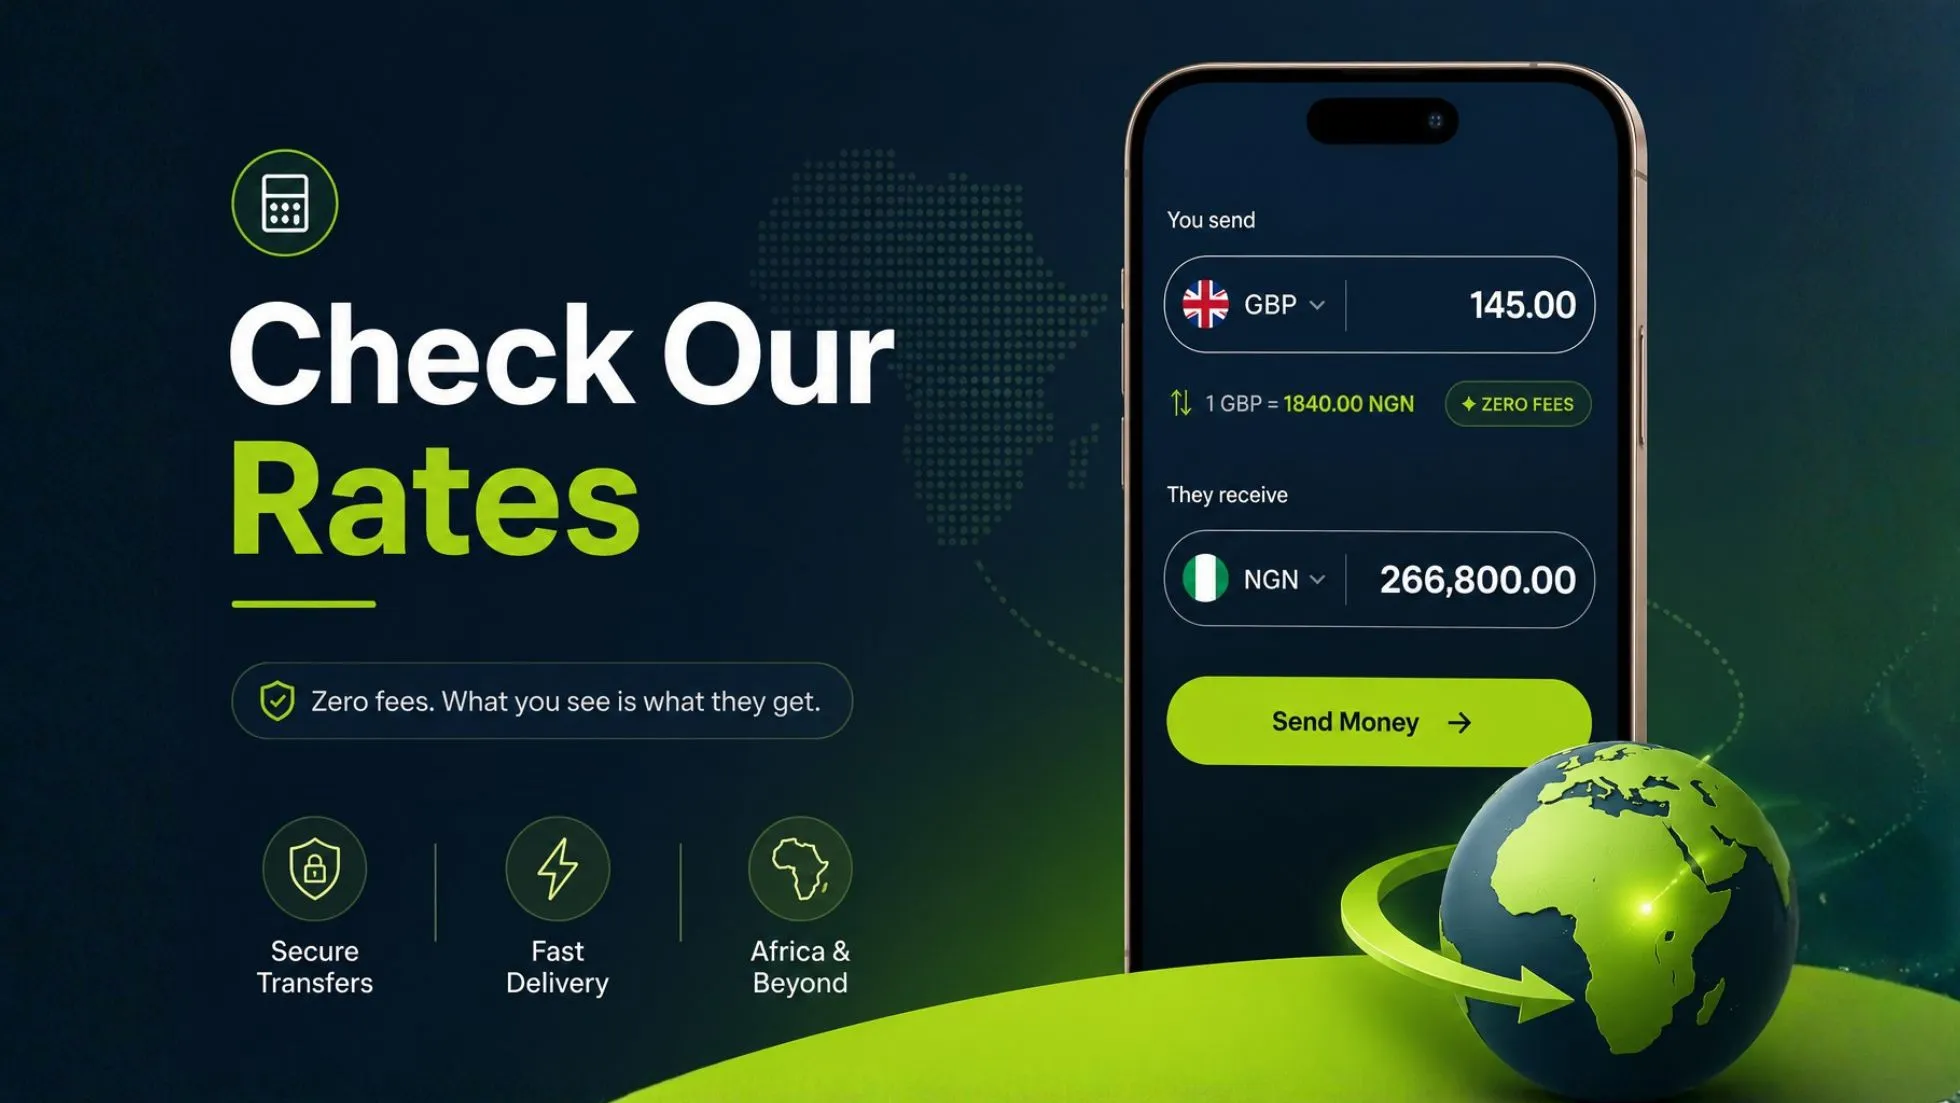
Check Our Rates
Fast, secure transfers to Africa and beyond
-
GBP
United Kingdom
-
USD
United States
-
CAD
Canada
-
AUD
Australia
-
EUR
Eurozone
-
GHS
Ghana
-
NGN
Nigeria
-
KES
Kenya
-
XAF
Cameroon
-
UGX
Uganda
-
XOF
Senegal
-
XOF
Ivory Coast
-
MZN
Mozambique
-
ZAR
South Africa
-
RWF
Rwanda
-
TZS
Tanzania
-
INR
India
-
BDT
Bangladesh
Zero fees. What you see is what they get.

What to do before your next transfer
Start with the mid-market rate. Look it up on any currency converter, note the number, and treat it as the benchmark. Every provider’s rate will be a little worse than that; the question is only by how much, and whether the gap is bigger or smaller than the fee they are advertising instead.
Then ask your recipient how they want the money — international money transfer fees vary by payout route, and you can check PayAngel’s supported countries and payout routes before you decide. Mobile wallet payout is consistently among the least expensive routes, and it is well covered across the African corridors. Cash pickup costs more but reaches people no digital route can. Bank deposit is the most familiar option and rarely the lowest-cost one. The right answer is the least expensive route your family can actually use.
Finally, compare recipient amounts — not fees — across two or three services, on the same day, for the same amount. PayAngel is a reasonable place to start that comparison when you are sending to a supported country: no transfer fee, no service fee, the exchange rate and the recipient amount visible before you confirm, and FCA regulation behind it. If another provider gets more money to your family on your corridor, that is the one to use. The habit of checking is worth more than any single provider.
Frequently asked questions
International money transfer fees are high because providers are pricing three things at once: moving money between two regulated financial systems, converting the currency, and the compliance work behind every payment. Most of the cost sits in two places — an upfront transfer fee and a margin added to the exchange rate — and providers trade one against the other. The World Bank puts the global average total cost of sending $200 at 6.36 percent, with banks at 14.99 percent and money transfer operators at 4.72 percent.
The most recent World Bank figure, from its Remittance Prices Worldwide report covering Q3 2025, is a global average of 6.36 percent of the amount sent, based on a $200 transfer. Sending $500 averages 4.08 percent, because the fixed portion of the fee spreads across a larger amount. The UN target is 3 percent by 2030.
It is the difference between the mid-market rate — the rate banks trade at, which you can look up for free — and the weaker rate a provider offers you. The provider keeps the difference. On international bank wires it is commonly 1 to 3 percent of the amount sent, and it never appears as a line item on your receipt.
No. A zero-fee transfer means no transfer fee is charged; the exchange rate is still part of what the transfer costs. PayAngel charges no transfer fees and no service fees on supported routes, and the rate applies as it does everywhere. Some services waive fees on a first transfer, between users of the same app, or on selected routes — check the recipient amount rather than the fee line.
Sub-Saharan Africa averages 8.46 percent, the highest of any receiving region, against a 6.36 percent global average. Fewer providers compete on each corridor, the currencies trade in thinner markets, cash payout is more common and costs more to service, and correspondent banks have withdrawn from parts of the region, leaving fewer routes.
Where a fixed fee applies, one larger transfer usually costs less as a percentage — $200 averages 6.36 percent while $500 averages 4.08 percent. The exchange rate margin is a percentage, so it does not shrink with size. On a service with no transfer fee, the frequency question matters far less and the rate is what to watch.
Mobile wallet payout averages 3.92 percent, cash pickup 5.56 percent, and bank account deposit 7.86 percent. Sending to an account at the originating bank or its partner is the most expensive route measured, at 13.91 percent. Choose the least expensive route your recipient can actually use.
Consistently, yes. Banks average 14.99 percent on a $200 international transfer against 4.72 percent for money transfer operators, and they have sat above the global average for the entire period the World Bank has tracked. A typical outgoing international wire in the US costs around $45 before the exchange rate margin and any correspondent bank deductions.
Run the same amount, on the same day, to the same payout method, through both. Then compare one number: how much the recipient receives. That figure already contains the fee, the exchange rate and the payout route. Anything else is a partial view.
No. PayAngel charges no transfer fees and no service fees on supported international transfers from the UK, US, Canada and Australia. The exchange rate applies and forms part of the cost, so the app shows the rate, the delivery estimate and the expected recipient amount before you confirm the transfer.
Send money home. Pay zero fees.
You cannot control the exchange rate. You can control who you send with, how the money arrives, and whether you check the recipient amount before you press send. Those three decisions account for most of the difference between a 3 percent transfer and a 14 percent one.
PayAngel sends from the UK, United States, Canada and Australia to supported countries across Africa, plus India and Bangladesh — with no transfer fees, no service fees, and the rate and recipient amount shown before you confirm. Check it against whatever you use today. That is the only comparison that counts.
Cost figures cited from the World Bank’s Remittance Prices Worldwide, Issue 54 (Q3 2025 data, published 2026), and from published bank fee surveys. Provider pricing changes by corridor, amount and date — check the live quote before you send. PAYANGEL® and PAYINC® are trading names of PAYINC GROUP LIMITED (registered in England & Wales, Company No. 08126178). PAYANGEL® is authorised for the provision of payment services by the Financial Conduct Authority (FCA) (FRN: 608108).